Data Analytics Lifecycle
Data analytics takes a lot of time. You have to clean the dataset, figure out what’s what and start thinking about which variables are going to help you answer your question. This should lead to some data exploration. You need to get a feel of what you are working with so that you can decide how to approach your question with what you have (or you find what your missing and try to aggregate it).
For the Chicago crime project, the data set comes directly from the Chicago police department (and from the website). It contains information about crime incidents in the years 2001 to 2019. For the sake of computing time, I will focus on the most recent full year, 2018.
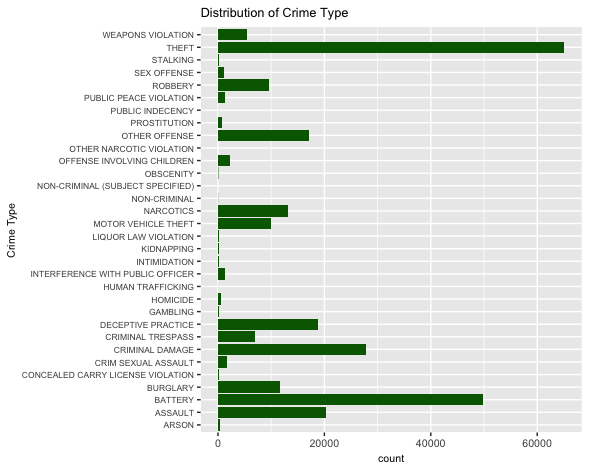
Doing some general exploratory analysis, we see that the most common type of crime in 2018 was theft with a bit over 65 thousand observations. From these thefts, 6,308 of them lead to arrests, which means that less than ten percent of thefts lead to arrests. There were a total of 52,772 arrests that year, which is 19.8%.
The following types of crimes have less than 40 observations: Domestic Violence (0), Human Trafficking (14), Non-Criminal (39), Other Narcotic Violation (1), Public Indecency (14), Ritualism (0).
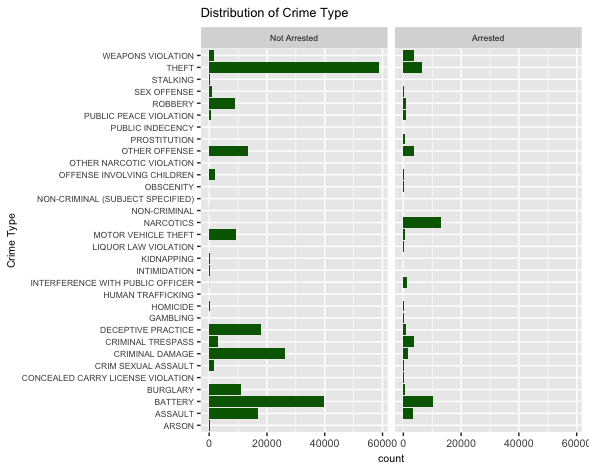
We can also look at the distribution of the crime types based on whether or not they were arrested. We see now that Narcotics has the highest amount of people getting arrested. This makes more sense as that’s considered a higher level crime in the U.S.. Battery is the second highest.
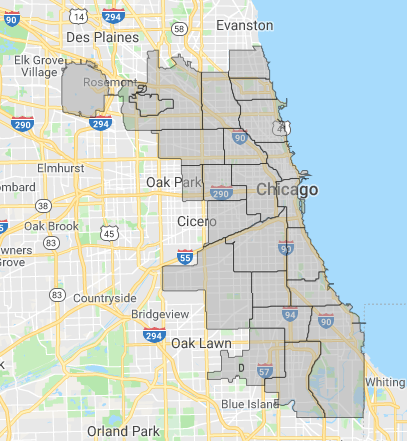
The data gives us zipcodes that don’t really make sense to me, considering most zip codes in Chicago start with 6 but these don’t. So instead we are going to look at the police districts. While the graph doesn’t tell you which is which, if you go to the website and hover over the spots, it will tell you which district is which. This dataset contains nothing on district 8, which seems strange.