Information Visualization
When making data visualization, one has to take into consideration what information you want to get the viewer to come out with. The creater needs to make sure that there is enough information so the viewer can learn something but you can’t overload it because it’s make the visualization to difficult to understand. There is a balance that must be taken into consideration.
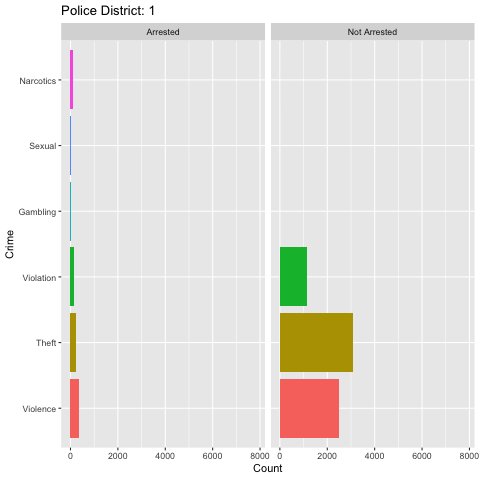
For this plot, we are looking at how the amount of crime types changes based on which district we are looking at. This could be done by facet wrapping on districts but that would have given us over 25 plots to look at and that could be overwhelming. Instead we can just see a visual change on the same plot.